Include a numeric variable in a Gnuplot title or legend
I was fitting a function to some data using Gnuplot, and then I wanted to include the result of the fit in the legend of my plot. Well, up to here the script looks like the following:
# my function to fit the data
f(x) = A*x**B

# initial values for the fit
A = 1
B = 1

# do the fit, use column 2 as x and the absolute value of column 5 as y
fit f(x) "data.csv" using 2:(abs($5)) via A, B
[... lots of output from fit ...]
Now the variables A and B have a new value, resulting from the fit:
print A, B
46.437770413374 0.153260265112221
I can plot the data together with the fit:
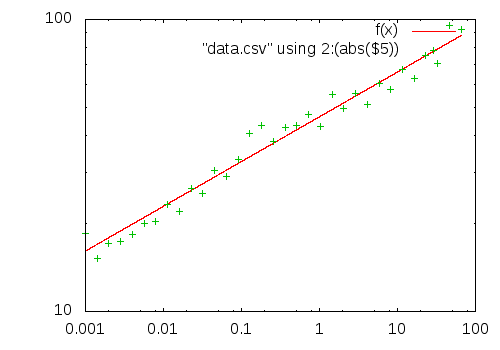
set output "data.png"
set terminal png

set logscale xy
set samples 10000

plot f(x), "data.csv" using 2:(abs($5))
This generates the following image:
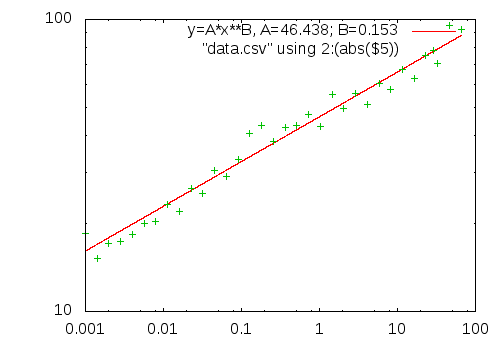
Now I would like to have a legend for the fit like the following:
"y=A*x**B, A=46.437; B=0.153"
After digging a bit in the documentation, I discovered that Gnuplot has an sprintf function that can be used more or less everywhere where a string literal would work. So that's how I got what I wanted:
[...]
plot f(x) title sprintf("y=A*x**B, A=%.3f; B=%.3f", A, B) ,\
"data.csv" using 2:(abs($5))
And that's what it looks like: